City of Joburg : Modelling the Impact of Solar PV on the Electrical energy load profile
Project Inception: July 2023
Background
In line with the smart city initiatives of the City of Johannesburg, Metropolitan Trading Company (MTC) required the services of reputable service providers to perform comprehensive feasibility studies on the implementation of Solar Rooftop PV at the various municipal buildings and Facilities. This includes the modelling of the impact of Solar PV power generation on the expected electrical energy load profile.
Modelling the Impact of Solar PV on the Electrical energy load profile
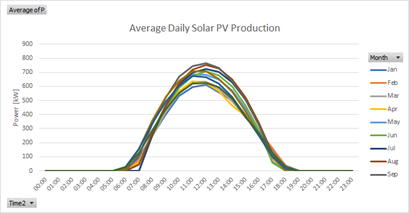
The PVGIS satellite weather data was used to determine the average expected electrical energy production from a Solar PV installation. The PVGIS tool provides the user with the option to download hourly radiation data for the selected location from 2005 up to 2020. The PVGIS tool further includes a method for calculating the expected electrical production in Kilowatt for each hour of the day, for each day of the year based on a set of simple assumptions and user inputs.
The hourly Solar PV estimated electrical power production values is processed in Microsoft Excel to obtain the average daily production curves per Kilowatt of installed solar PV for each month of the year. An example of a set of production curves for north facing panels installed at a 26° slope/angle in the Johannesburg area is shown in the figure below. These daily production curves are then used to model the expected solar production at a site based on the size and installation parameters of the solar PV system.
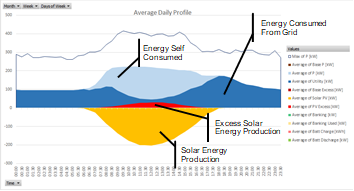
These production curves are then modelled onto the customers electrical load profile data for hour of the day for 12 months. The result of this calculation is visualised in an average daily energy profile and an example is shown in the figure below.
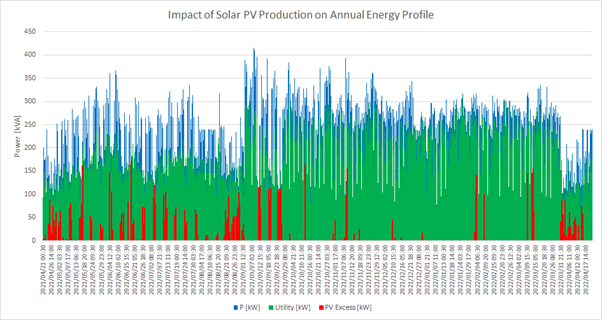
The impact of solar PV production as applied to the 12-month energy profile is illustrated in the Figure below where the profile in Blue shows the energy consumption of the customer, while the Green profile shows the energy profile consumed from the Utility.
The profile for the potential energy exported back into the utility grid is also determined with this model and is shown in Red in the figure above.